

Project information
- Category: Data-Science
- Technology: Python, R
- Project date: December, 2021
- Project URL: video project
Airbnb Under Covid19
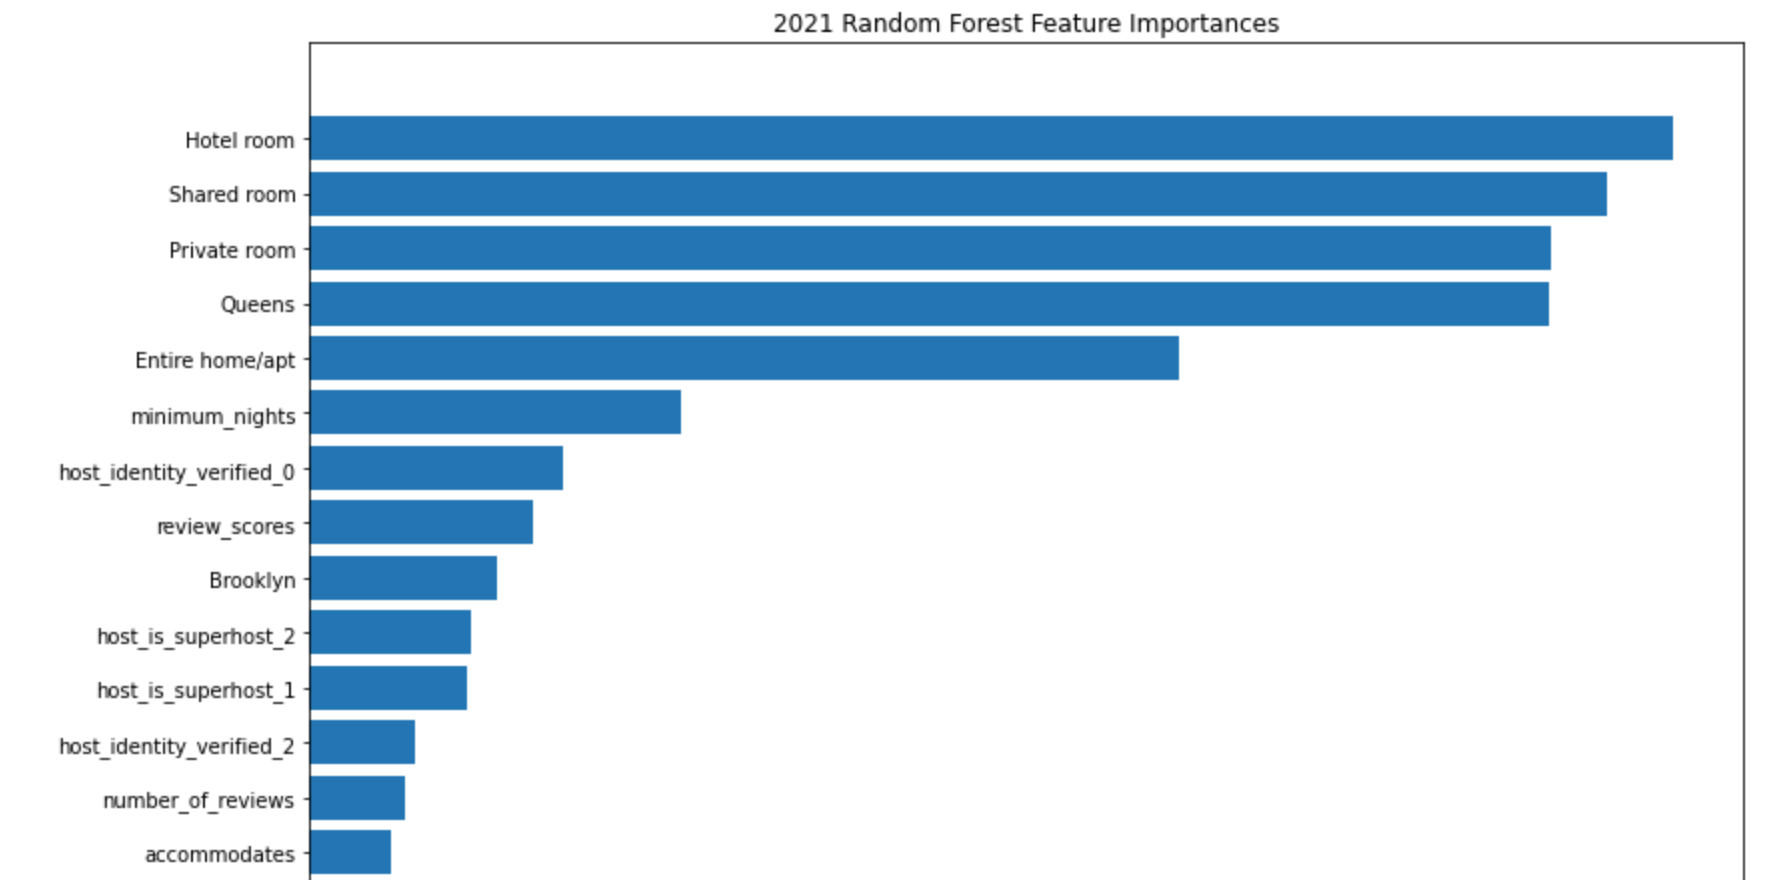
Our project aims to analyze the correlation between the Covid19 and Airbnb and how it could reflect people’s preferences. We first did the exploratory data analysis on Airbnb data and covid data. We drew a heat map of price of Airbnb in 2017 and 2021, a map of covid cases in NYC with time slider and plot the quantity of Airbnb orders and covid cases over time. By visualizing data, we could find that the pandemic does not change the price of Airbnb a lot and the pandemic has a negative impact on Airbnb order quantities. Then, we tried different models to validate our thoughts. We used ordinary least squares method to analyze the Airbnb orders and covid cases. We found out that there is significant negative correlation between the number of covid cases and the number of Airbnb reviews. Next, we used machine learning and did the back attribution to look at the feature importance to analyze how it changes between years. According to the random forest model that we picked, we found out that locations are playing a smaller role in 2021 when people consider Airbnb price, while the room type became more important comparing to data in 2017.